You don't manage what you don't measure
A building without data is managed „by feel”. The main meter shows a total, but not which system, floor or tenant drives consumption. Without that, every optimisation is guesswork.
The data layer turns that guesswork into decisions. And — despite appearances — it doesn't start with a big platform, but with a few of the right measurements.
Step 1: submetering where cost is decided
You don't need to meter everything at once. Start with the areas and utilities with the largest share of cost and the greatest potential for improvement — HVAC, common-area lighting, the main energy loads.
This targeted submetering gives a first real picture of consumption at limited cost and quickly shows where the money is.
Step 2: integration and gateways
Readings from different systems must be brought into a single layer. Integration gateways and a common data model turn the BMS, meters and sensors from separate islands into one source of truth about the building.
It is the most often skipped step — and it decides whether the data will be useful, or merely plentiful.
Step 3: a dashboard that leads to action
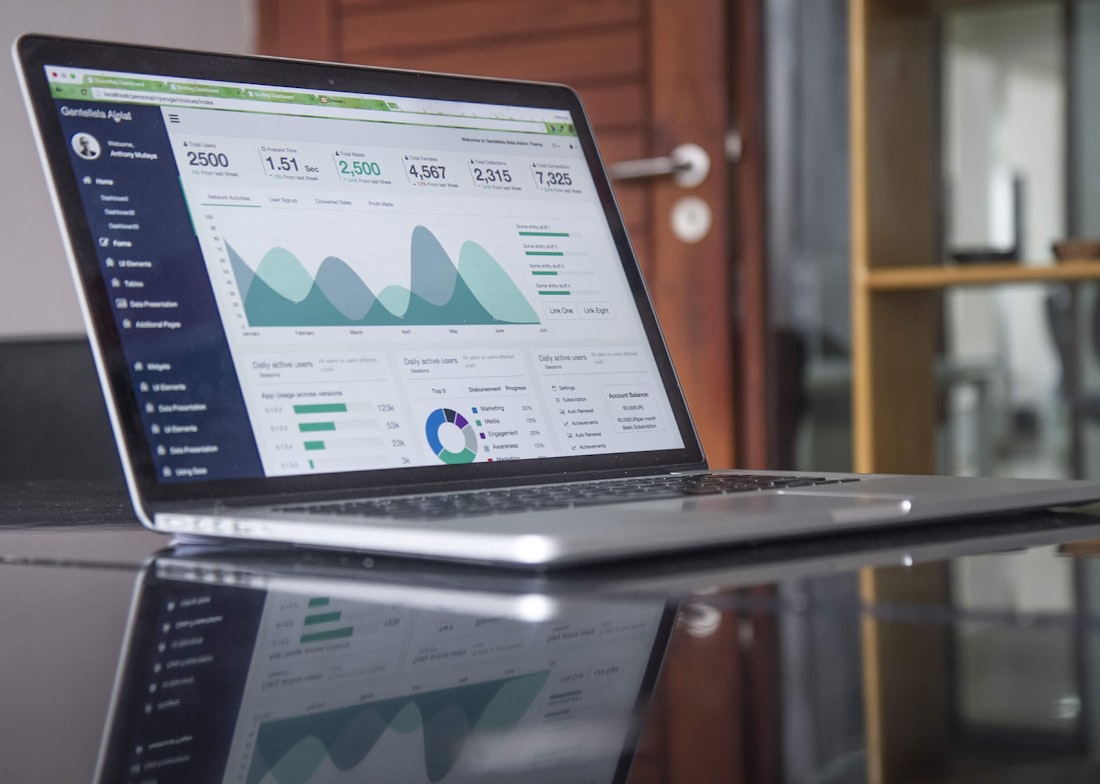
A good dashboard is not a gallery of charts, but a decision tool: anomaly alerts, efficiency indicators and concrete recommendations. It should answer „what to do today”, not just „what happened”.
It is also the layer that feeds ESG reporting with reliable operational data — without manual collection at the end of the quarter.
Why it pays back
The data layer pays back in three ways: through operating savings (waste caught sooner), through ESG readiness (data that investors and regulation will require anyway), and through the durability of the retrofit effect, which becomes documentable.
It is also the entry point to the Remote Building Operator model, where live data drives the next, ever better targeted decisions.
Building data isn't an expense for later, but the foundation on which every next decision stands. Remote Building Operator turns it into continuous value.